Pruning Support Vectors Using Clustering for Online ML Applications
Motivation : Big data classification demands Support Vector Machine (SVM) models with a huge number of support vectors. This makes the models complex, prone to overfitting, and computationally expensive. Reducing the number of support vectors decreases latency and hardware requirements, enabling real-time classification on low-power devices.
Analogy : Imagine a large committee of experts where many share very similar opinions. Instead of consulting every single expert individually (which is time-consuming), you group them by their viewpoints and select a single representative for each group. This speeds up decision-making while maintaining the overall accuracy of the consensus.
Use Cases: Applications involving long-term forecasting (like weather or climate prediction), time-critical systems requiring rapid performance, and real-time implementations on low-power computing devices where hardware constraints exist.
Approach :
- An initial optimum SVM model is trained conventionally.
- A clustering algorithm (e.g., K-means) is applied to the extracted support vectors of this trained model.
- The support vectors are aggregated into clusters, removing redundant and non-essential vectors.
- The original support vectors are swapped with the obtained aggregated clusters.
- The new reduced set of support vectors is tested and fine-tuned to ensure the classification performance remains robust despite the massive reduction in support vectors.
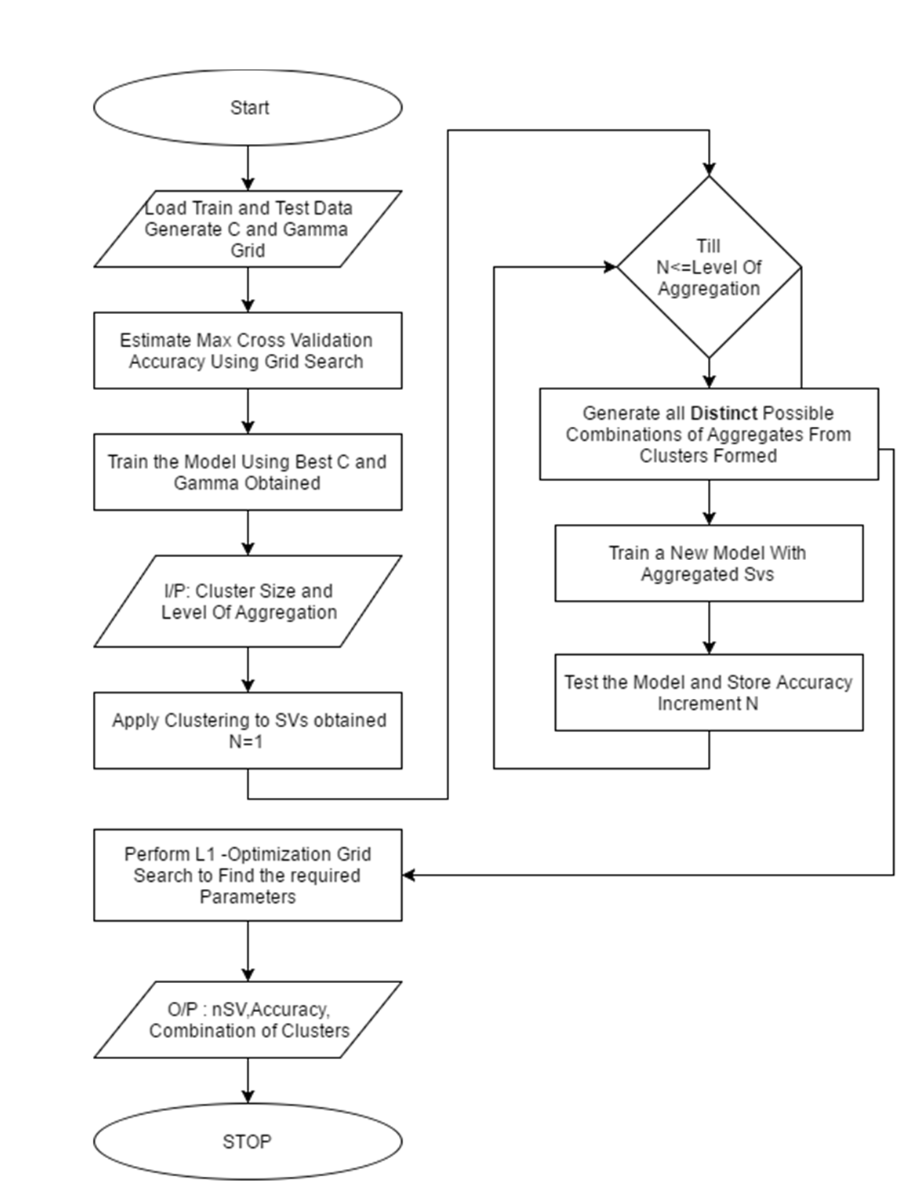
Process is commenced by loading the training instances along with its corresponding class labels in the required syntax. Grid search is performed to obtain optimum C and Gamma parameters. The C and gamma parameter are found from the respective cross validation Accuracies obtained and the values are taken. The C and gamma parameters are again fine-tuned by making a fine grid in a suitable range for better performance. They are taken as Best C and Best gamma. Using this Best C and Best gamma Parameter, an optimum SVM model is trained. Now, clustering algorithm is applied to the support vectors obtained for this trained model. These Clusters are then used for aggregation. Aggregation of these support vectors into all possible distinct groups is done based on the level of aggregation and cluster size given as input by the user. These aggregated clusters are to be swapped with existing support vectors of the model and then tested to obtain the accuracy. This process of aggregation is done till all possible distinct groups are tested. The respective combination of clusters obtained, level of aggregation, cluster size and corresponding accuracy are stored for further processing. The L1–optimization grid search is performed to find the best parameter as per Requirement.
Results
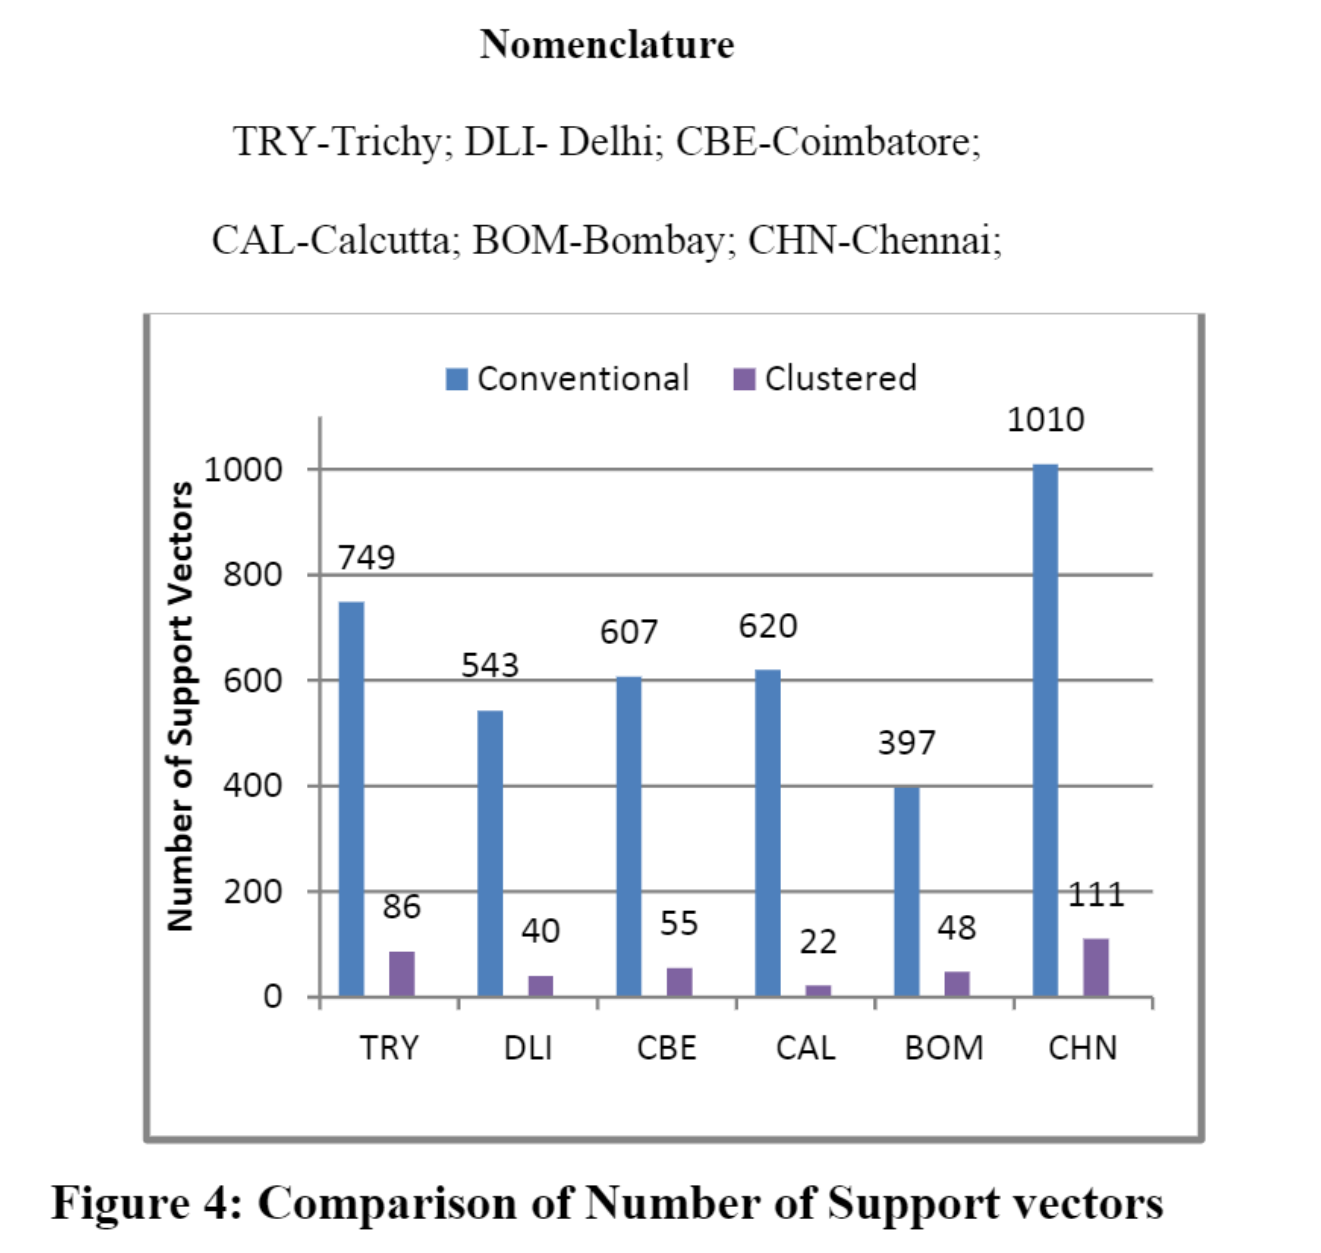
Figure 4 illustrates the correlation between the number of support vectors for the model obtained when conventional SVM approach and clustered approach are used. It is inferred that Chennai has highest number of support vectors when trained using conventional method (1010) and these get reduced to 111 (89% Reduction) when clustered approach is followed. Delhi has the highest (92.6%) reduction of number support vectors from 543 to 40 support vectors. On an average the proposed method has 90% reduction in number of support vectors.
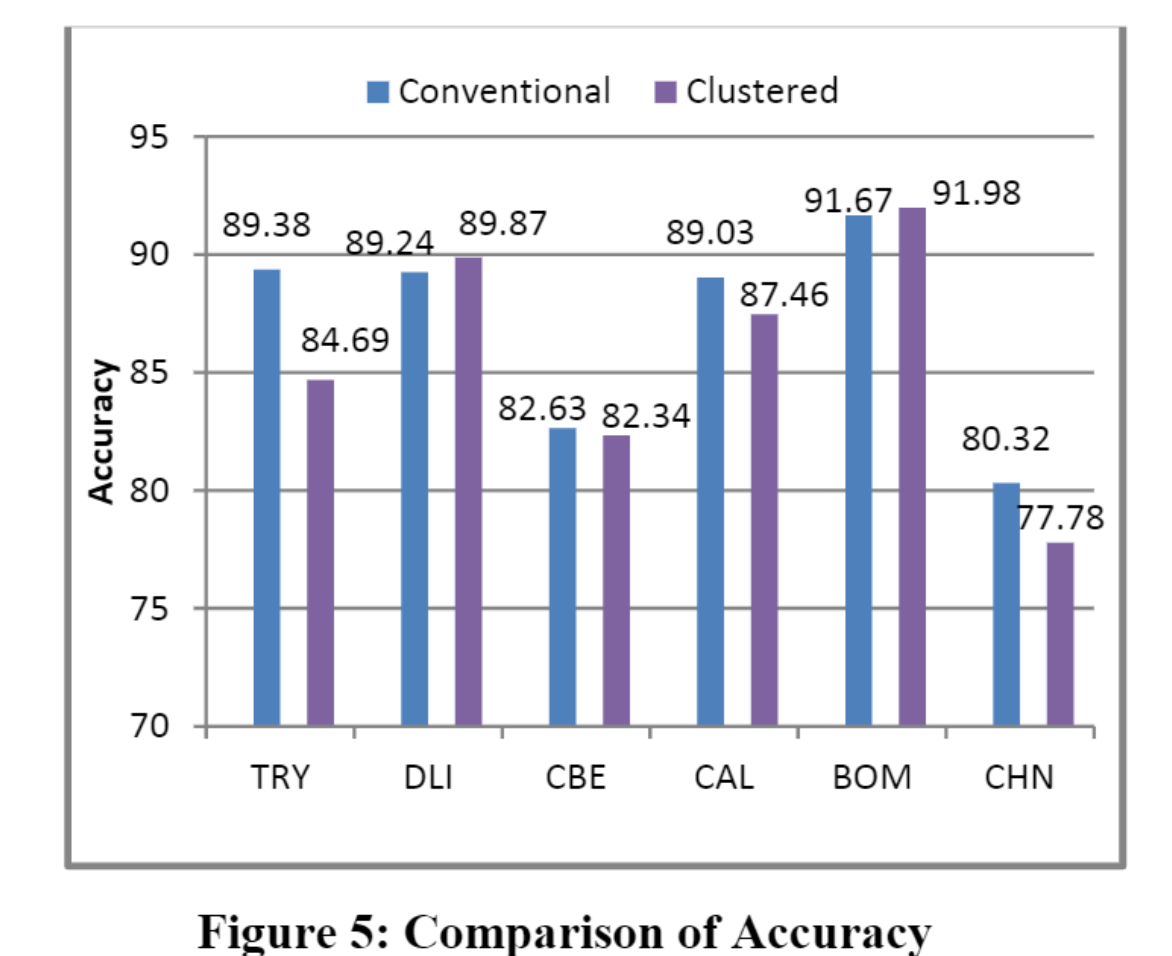
Figure 5 illustrates the comparison between accuracies for the model obtained when conventional SVM approach and clustered approach are followed. The performance of the proposed approach is almost similar to that of conventional method. Models of Delhi and Bombay obtained using clustered approach (89.87% & 91.97%) performed better than the conventional SVM method (89.2% & 91.6%) while Trichy and Chennai had reduction in accuracy of 4.6% & 2.53% respectively along with the reduction in support vectors. Hence, we can infer that the proposed approach has performance similar to that of conventional SVM method with a maximum deviation of 4% in accuracy.
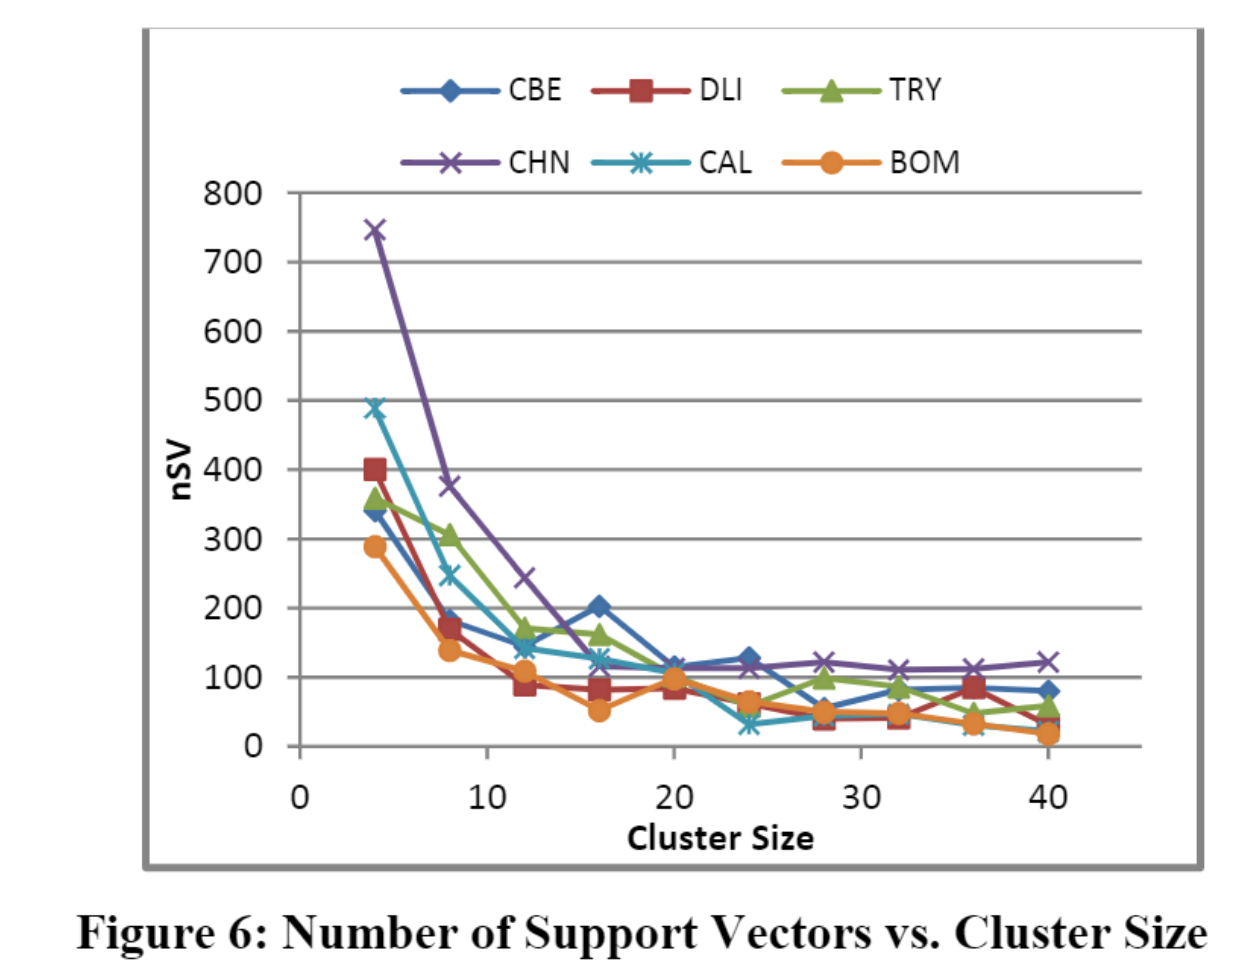
Figure 6 illustrates the reduction of number of support vector as the cluster size increases. Due to increase in number of clusters the redundant and non-essential support vectors which have negligible effect on the accuracy gets removed and only essential support vectors are extracted from the total support vector set. Hence, as the cluster size increases the number of essential support vectors gets supressed exponentially.
Code for the Experiments Available at: https://github.com/Gokkulnath/SVM-Experiments (The code was written in MATLAB. Repo also has the dataset scraped from various sources)
Preprint: A Novel Clustered Support Vector Machine with Reduced Support Vectors for Big Data Classification https://www.techrxiv.org/doi/full/10.36227/techrxiv.12895025.v1. PDF available at https://www.techrxiv.org/users/663307/articles/676023/master/file/data/PID4236033/PID4236033.pdf